|
MONTHLY MUSINGS · JUNE 2026
|
|
|
|
From the BlockBytes® desk —
|
|
FROM OUR CEO
Market Briefing & Outlook
Markets have spent the last several months consolidating, and it's natural to feel that quiet stretches like this call for caution. We see it differently.
Zoom out, and the picture is clear: Bitcoin's move from roughly $16,000 to above $125,000 was overwhelmingly an institutional story. Spot ETF flows, corporate treasury allocations, and large-scale custodial accumulation did the heavy lifting — not retail speculation. That's an important distinction, because it tells us where we are in the cycle, not just how far we've come.
Bitcoin dominance has been the clearest evidence of this. It climbed from the high-40s at the start of the ETF era to the mid-60s at the cycle's most recent peak — institutional capital piling into the asset it trusts most, while the broader altcoin market was left behind. Retail has simply not shown up at scale this cycle. That's not a weakness in the market; it's unfinished business.
|
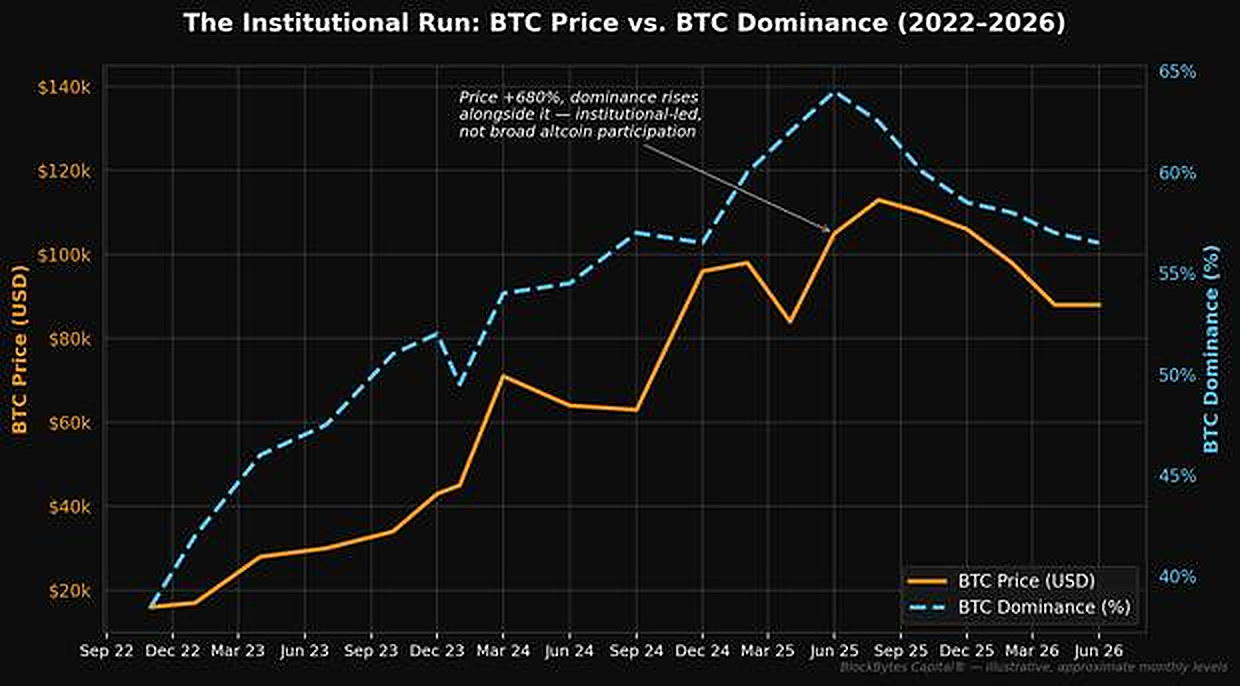
Figure 1 — BTC price vs. BTC dominance, 2022–2026. Dominance rose alongside price, confirming the institutional rather than retail character of this run.
|
|
Here's the setup we're watching closely: the next leg of this market is unlikely to look like the last one. As institutional positioning matures and dominance eventually rolls over, we expect Bitcoin dominance to underperform meaningfully relative to the broader altcoin index. Historically, that kind of rotation — capital moving down the risk curve from BTC into ETH, large-cap alts, and eventually smaller names — is what altseasons are built from.
We're not there yet. Dominance currently sits well above the zones that have historically marked the start of past rotations, which tells us this move hasn't started in earnest. But that's exactly why current levels matter.
|
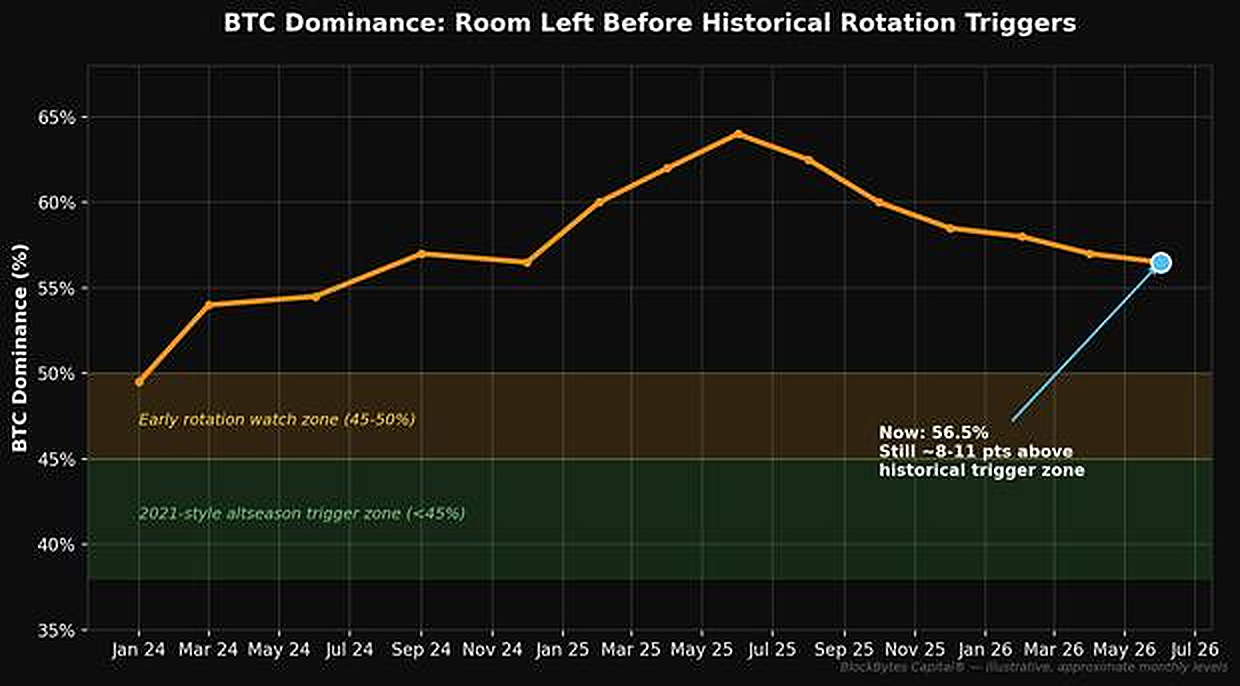
Figure 2 — BTC dominance relative to historical altseason rotation zones. Current levels remain well above past trigger points.
|
|
Two further indicators reinforce this picture. The first is the ETH/BTC ratio — the cleanest read on whether capital is rotating into the broader market or staying concentrated in Bitcoin. It remains in a multi-year downtrend, recently touching a 10-month low and sitting well below its long-run average. Ethereum, historically the bellwether for altcoin strength, has been a laggard rather than a leader this cycle — further confirmation that the rotation we're positioning for hasn't begun.
|
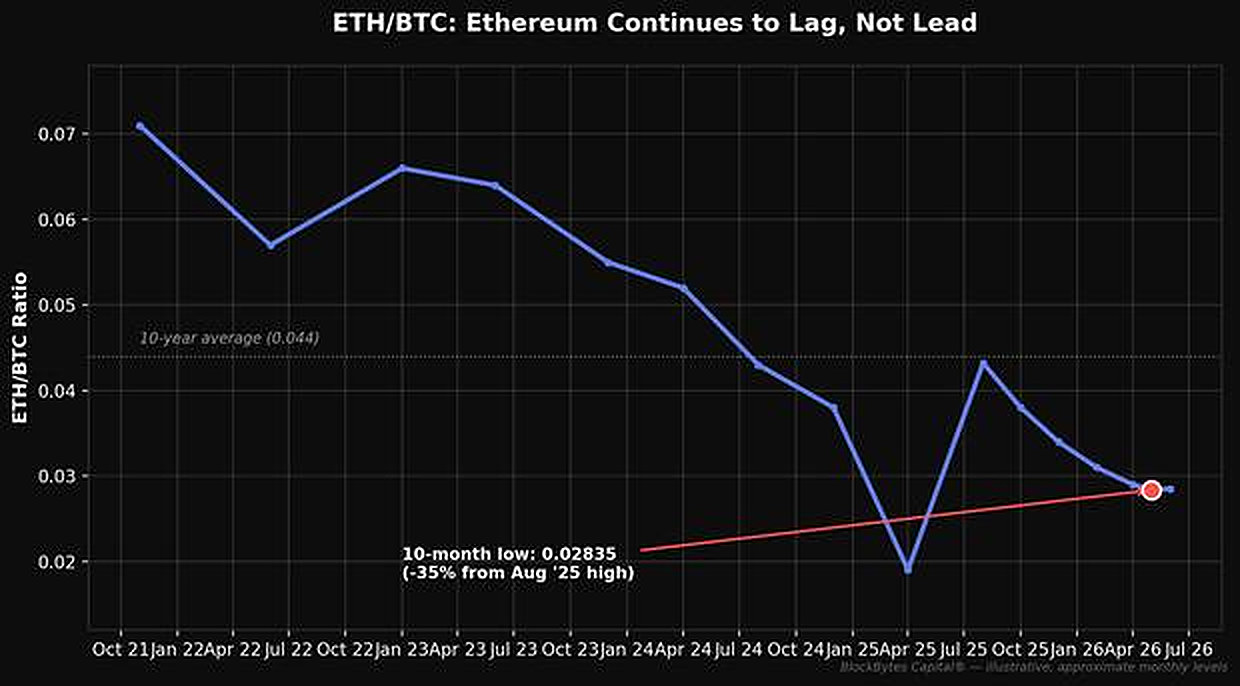
Figure 3 — ETH/BTC ratio, 2021–2026. Ethereum continues to underperform Bitcoin, with the rotation signal still absent.
|
|
The second is TOTAL3 — total crypto market capitalization excluding Bitcoin and Ethereum, and the cleanest single gauge of pure altcoin strength. Across three separate cycles now, TOTAL3 has run into the same resistance near $1.3 trillion without breaking through to a new all-time high. We're currently consolidating well below that level. A decisive break above it, paired with a falling BTC.D and a turning ETH/BTC ratio, is the combination we'd expect to see at the start of a genuine altcoin season — and it's the signal set we're watching most closely from here.
|
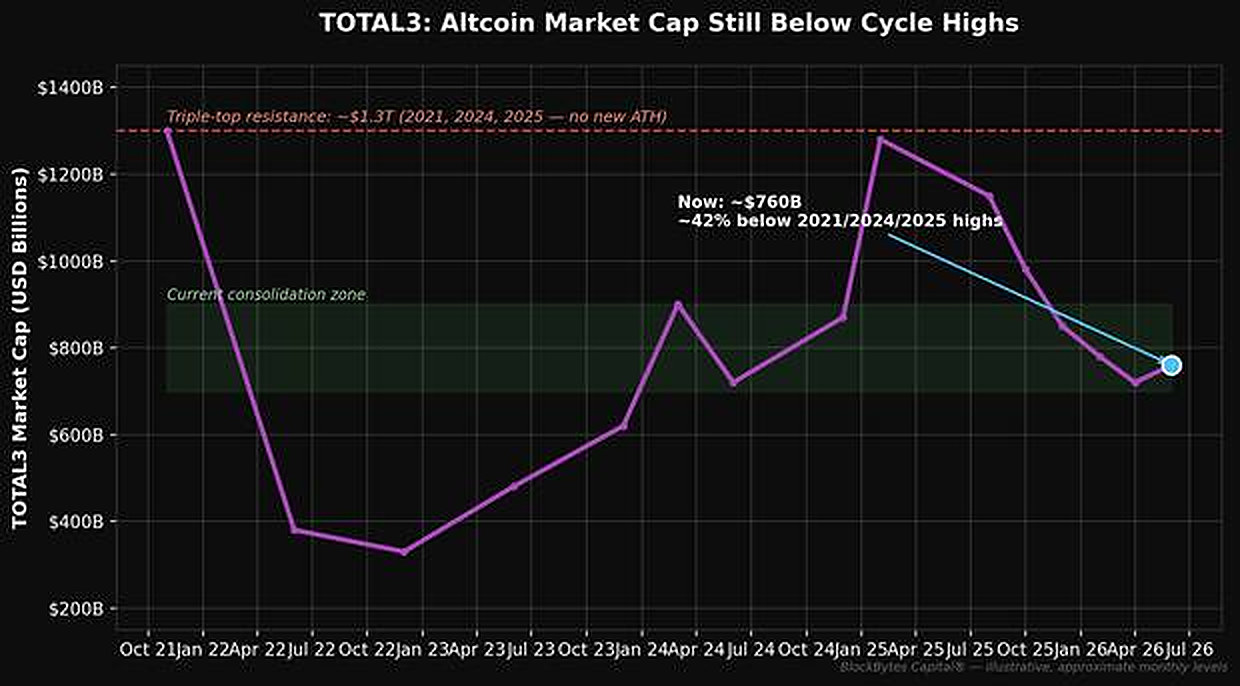
Figure 4 — TOTAL3 (altcoin market cap ex-BTC/ETH), 2021–2026. Repeated rejection at the same resistance level across three cycles, currently consolidating below it.
|
|
| |
|
Positioning & What's Ahead
This is the part of the cycle that rewards positioning, not prediction. We don't know the exact week dominance turns, and we're not interested in pretending we do. What we do know is that consolidation phases like this one have historically been where the foundation for the next leg gets built — for those who stayed positioned through them.
Our approach over the coming months reflects that view: continuing to accumulate Bitcoin systematically while methodically building exposure to the assets we believe are best positioned to lead if and when capital begins rotating out of BTC. We'd rather be early and patient than late and reactive.
Our selection process is centered on two things: proven utility — does the network or protocol solve a real problem and generate real usage — and alignment with the regulatory framework taking shape in the United States. The assets built to operate within that framework, rather than around it, are the ones positioned to attract durable institutional capital over the next phase of this market. That filter shapes everything we add to client portfolios.
We remain bullish on where this market is headed. Not because every month will be a straight line up — it won't be — but because the structural setup, institutional foundation, and historical pattern of these consolidation periods all point in the same direction.
As always, if you have questions about your portfolio or how we're thinking about positioning from here, reach out directly.
|
| |
|
The Patience Advantage
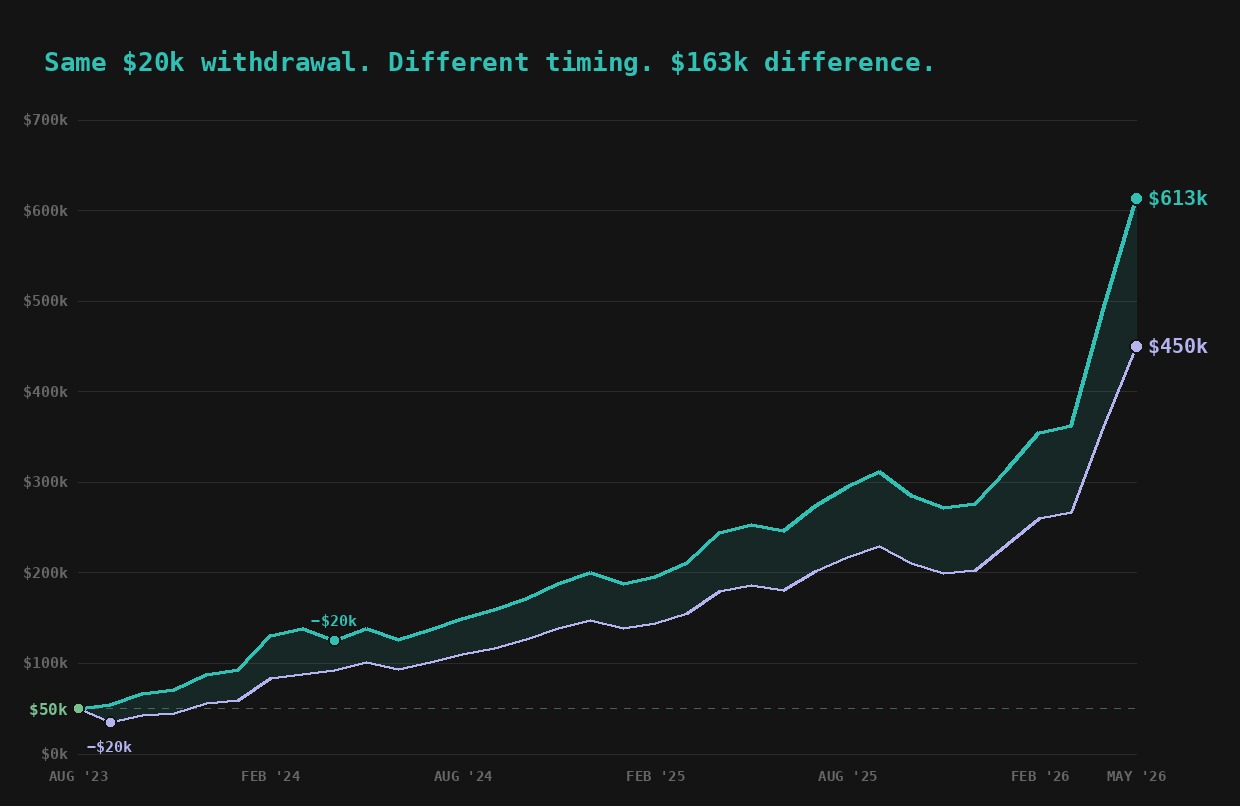
Some of our OG account holders were here the last time we were in a consolidation phase followed by a strong markup — it was 2023. Using their actual performance data, we built something to show you the difference between withdrawing during such a period vs. right after.
|
|
|
Simulated using real BlockBytes Capital® performance data
The takeaway isn't “don't withdraw” — it’s that timing shapes the outcome more than you realize. A ‘boring’ or ‘scary’ market is designed to make investors withdraw exactly when they shouldn’t. “Just 20k” isn’t just 20k, as seen above.
If you’re thinking about it, reach out. We’re happy to walk you through what it looks like for your specific position.
|
|
Warm regards,
The BlockBytes Capital® Team
|
|
|
BlockBytes Capital®
8000 Towers Crescent Dr, Suite 2350, Vienna, VA 22182
[email protected]
|
BlockBytes Capital®
This communication is intended solely for the named recipient and contains confidential information. If you received this in error, please disregard.
|